
Padel growth is changing the questions I receive from club investors, distributors, and contractors. More buyers now ask about multi-court layouts, utilization, and expansion plans rather than one demonstration court. That interest is encouraging, but global enthusiasm can hide weak local economics. Investors still need evidence from their own cities before committing capital.
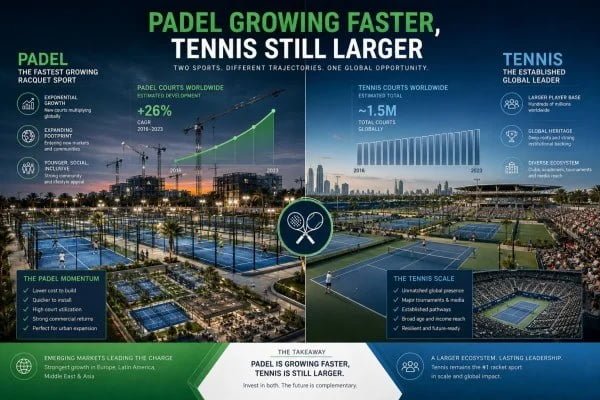
Padel is growing faster than tennis on selected measures, especially new-court development in emerging markets.1 However, tennis remains much larger by total players, clubs, and courts.2 Because industry reports use different years and definitions, investors should compare matching metrics and treat global padel growth as a reason for local due diligence—not as proof of profitability.
In my work as a padel court manufacturer and exporter, I can see procurement interest through inquiries, orders, and shipment patterns. Those signals help me understand buyer confidence, but they do not measure participation or market share. A sound comparison requires independent data, consistent definitions, and city-level commercial research.
What Does “Padel Growth Faster Than Tennis” Actually Mean?
I often hear investors say that padel is the “fastest-growing sport,” but that phrase can create more confusion than clarity. A high percentage from a small base may look dramatic while a mature sport adds more players in absolute numbers. Without a defined metric, the comparison has little investment value.
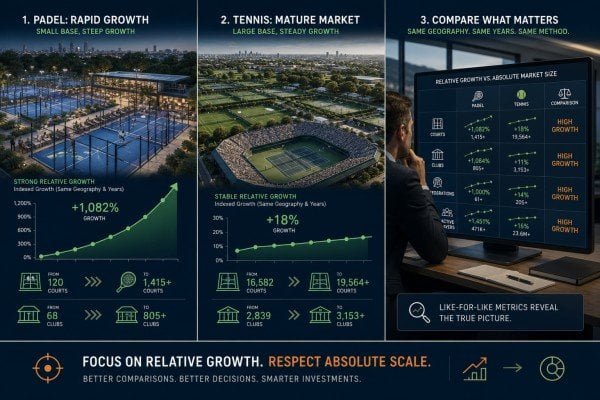
Padel growth can be faster than tennis growth when measured by the percentage increase in courts, clubs, registered federations, or active players over a specific period. However, a valid comparison must use the same geography, years, and measurement method. It must also separate relative growth from absolute market size.
I Separate Growth Rate From Market Scale
I use a simple example when discussing this issue with prospective buyers:
- A city has 10 padel courts and adds another 10.
- The same city has 200 tennis courts and adds another 20.
- Padel records 100% court growth.
- Tennis records 10% court growth.
- Tennis still adds twice as many courts and remains much larger.
Both statements can therefore be true: padel can grow faster, while tennis maintains a far larger installed base.
I recommend that investors ask four questions whenever they see a sports growth statistic:
-
What is being counted?
The figure may count players, registered members, bookings, clubs, courts, or countries with a federation. -
What years are being compared?
A one-year increase can reflect recovery after closures, delayed construction, or a temporary investment cycle. -
Which geography does the figure cover?
Global growth may be concentrated in a small number of countries. It may not represent the investor’s city. -
Who produced the data?
A sports federation, booking platform, consultant, equipment company, and national statistics agency may use different methods.
Different Metrics Answer Different Questions
| Metric | What it can indicate | What it cannot prove |
|---|---|---|
| Number of players | General participation and awareness | Willingness to pay commercial court fees |
| Number of courts | Facility investment and available supply | Sustainable utilization |
| Court bookings | Actual playing activity at measured venues | Total participation outside the platform |
| Number of clubs | Operator confidence and market structure | Profitability of each location |
| Equipment shipments | Procurement activity | Player growth or supplier market share |
| Social media searches | Awareness and curiosity | Repeat participation or revenue |
My company’s inquiries and shipments belong in the procurement signal category. I can use them to discuss the types of projects buyers are considering and how regional requirements differ. I cannot use them to claim an independent participation rate, a national market share, or guaranteed commercial success.
I treat fast growth as a screening signal. I do not treat it as an investment conclusion.
What Do Current Padel Growth and Tennis Data Show?
The available reports support a broad conclusion that padel has experienced rapid international expansion. However, the datasets do not always support a clean race between the two sports. Padel and tennis reports often cover different periods, apply different player definitions, and measure facilities in different ways.
Current evidence suggests that padel court development has increased rapidly from a relatively small base, while tennis retains a much larger global ecosystem. Some reported padel metrics show a higher percentage growth rate. Tennis data, meanwhile, show substantial absolute participation and infrastructure that should not be overlooked.

What the Main Reports Indicate
The International Padel Federation’s World Padel Report 2024 described a sport operating across more countries, with approximately 30 million amateur players and more than 60,000 courts worldwide3. The report’s exact tables, definitions, and subsequent revisions should be checked before buyers reproduce these figures in an investment memorandum.
The International Tennis Federation’s Global Tennis Report 2024 reported approximately 106 million tennis players globally4. It also documented a much larger installed network of tennis courts, clubs, coaches, and national associations.
These reports point in the same general direction:
- Padel has a smaller absolute base.
- Padel has experienced strong court and geographic expansion.
- Tennis remains significantly larger in total participation and infrastructure.
- Neither global dataset proves that a new commercial club will work in a specific location.
Investors can review the original organizations rather than relying on recycled headlines:
- International Padel Federation
- International Tennis Federation
- Playtomic Global Padel Report resources
Because editions and methodologies change, I would record the report title, publication year, page number, metric definition, and retrieval date in any feasibility study. Figures taken from later editions should replace older numbers when the underlying definitions remain comparable.
Why I Avoid a Single Global Percentage
A simple table shows why one universal growth rate can mislead:
| Comparison issue | Padel dataset may use | Tennis dataset may use | Investor risk |
|---|---|---|---|
| Player definition | Amateur or occasional players | People who played at least once in a defined period | Participation is not directly comparable |
| Time period | Recent two- or five-year expansion | Survey intervals of several years | Annual rates may be distorted |
| Facility count | Dedicated padel courts | Public, private, school, and club tennis courts | Different facility categories |
| Geographic coverage | Markets reporting through federations or platforms | National association surveys | Missing countries affect totals |
| Commercial activity | Bookable club courts | Commercial and non-commercial facilities | Revenue potential appears overstated |
Booking-platform reports can add useful detail about reservations, peak hours, and player behavior. However, platform data represent the venues and users covered by that platform. I would not automatically treat those figures as a complete national market census.
The defensible conclusion is narrow: padel appears to be growing faster on several percentage-based participation and facility metrics, but the size and reliability of that advantage depend on the selected period and market.
Does Rapid Padel Court Growth Prove Strong Player Demand?
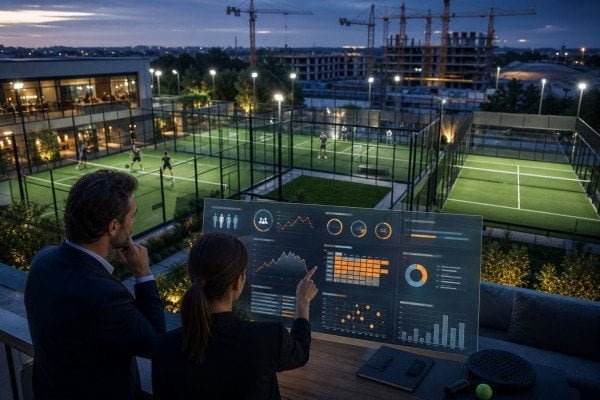
I sometimes see investors count new court projects and assume demand must be secure. That reasoning can become circular. Suppliers build courts because operators expect customers, but customer demand must still develop after the facility opens. If several investors follow the same trend, new capacity may arrive faster than paying players5.
No, rapid court development does not prove sustainable player demand6. New courts demonstrate investment activity and confidence, but they may also create oversupply. Investors should compare court capacity with unique paying players, repeat-booking rates, peak-hour occupancy, prices, customer acquisition costs, and seasonal demand.
Court Supply Can Grow Before the Customer Base
A standard doubles padel court accommodates four players per booking. That feature can support social play and shared booking costs. However, the court only earns revenue when players reserve it, attend, and pay.
An investor should model available playing hours instead of focusing only on the number of courts. For example, a six-court club open for 14 hours per day has:
- 84 court-hours of daily capacity
- 588 court-hours of weekly capacity
- Approximately 2,520 court-hours in a 30-day month
A projected 70% occupancy may sound reasonable, but the distribution matters. A club may be full from 6 p.m. to 10 p.m. and nearly empty during weekday mornings. Adding courts does not solve weak off-peak demand.
I would test at least three scenarios:
| Variable | Conservative | Base case | Optimistic |
|---|---|---|---|
| Average occupied hours | 25% | 45% | 65% |
| Realized hourly price | Lower local range | Expected blended price | Strong peak and off-peak pricing |
| Opening delay | 3–6 months | 1–2 months | On schedule |
| Customer acquisition cost | High | Moderate | Low |
| Maintenance downtime | Above plan | Normal allowance | Minimal |
| Food, lessons, and events revenue | Limited | Partial contribution | Strong contribution |
The exact percentages should come from local evidence rather than this illustrative framework.
I Look for Demand Evidence Beyond Survey Enthusiasm
Prospective customers often say that they would try a new sport. That answer is weaker than evidence that they will play twice a week at the intended price.
Stronger indicators include:
- Booking records from nearby clubs
- Waiting lists for peak periods
- Repeat-player percentages
- Local coaching and league activity
- Corporate or school program commitments
- Pre-opening memberships with meaningful deposits
- Search demand supported by actual inquiries
- Travel distance to existing facilities
- Customer interviews that include specific price questions
I also ask whether the area has substitution options. Players may choose tennis, pickleball, football, gyms, or other leisure activities. I do not frame those sports as enemies. They compete for some of the same time and household spending, but they can also share facilities and introduce customers to racket sports.
How Should Investors Evaluate Local Padel Growth?
Global headlines can attract an investor to padel, but the customer catches the ball locally. A successful club requires enough suitable players within a practical travel radius, a competitive price, reliable access, and a site that can support construction and operations. Weakness in any one factor can undermine an otherwise attractive concept.
I evaluate local padel growth through six areas: target customers, competing facilities, utilization, achievable pricing, site economics, and scenario-based returns. Investors should collect city-level data before ordering courts and should have qualified legal, structural, financial, and planning professionals review application-specific decisions.

1. Define the Paying Customer
A broad statement such as “the city has many young professionals” is not enough. I would create specific customer groups:
- Existing racket-sport players
- Social groups seeking evening activities
- Families and junior players
- Corporate teams
- Schools and universities
- Tourists and hotel guests
- Competitive players who need coaching and leagues
Each group has a different schedule, price sensitivity, and retention pattern. A hotel project may depend on guest occupancy, while a suburban club may depend on memberships and evening bookings.
2. Map Every Relevant Competitor
The investor should identify existing and announced facilities within realistic travel times. In a congested city, a five-kilometre distance can matter more than a 15-kilometre distance in a smaller town.
I would record:
- Number and type of courts
- Indoor, covered, or outdoor configuration
- Booking price by time
- Membership requirements
- Peak and off-peak availability
- Coaching programs
- Parking and public transport access
- Online review patterns
- Planned court additions
Announced projects deserve attention because several clubs may open during the investor’s construction period.
3. Test Pricing With Real Customers
A price from another country is not a reliable benchmark. Local income, land cost, climate, energy prices, and leisure habits all influence the acceptable hourly rate.
I prefer a limited pilot or presale test where possible. A temporary court, event partnership, or structured pre-opening campaign can reveal more than a general online survey. Investors should avoid counting non-binding expressions of interest as committed revenue.
4. Model the Complete Project Cost
The court package is only one part of the capital budget. A realistic estimate may include:
- Land purchase or lease deposit
- Planning permission and professional fees
- Ground investigation
- Drainage and foundations
- Court structures and artificial turf
- Freight, duties, taxes, and port charges
- Local transport and lifting equipment
- Installation labor and supervision
- Lighting power supply
- Roof or weather protection
- Clubhouse, changing rooms, and reception
- Booking software and access control
- Insurance, marketing, and working capital
- Spare glass, turf, fasteners, and maintenance tools
I recommend conservative, base, and optimistic payback models. A qualified financial adviser should review tax, financing, and return assumptions. No global padel growth statistic can replace that work.
How Does Padel Growth Affect Court Procurement?
Fast market expansion can pressure buyers to order quickly. However, a rushed specification may create missing components, foundation conflicts, delayed installation, or approval problems. I have found that experienced buyers spend more time defining responsibilities before production because they understand that a complete court is a coordinated system.
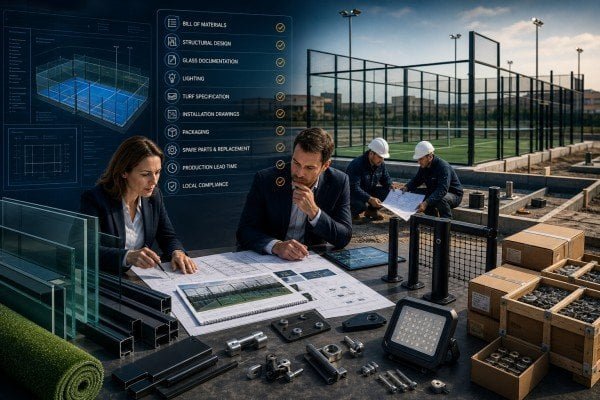
Padel growth should encourage disciplined procurement rather than speculative buying. Investors should confirm the bill of materials, structural design basis, glass and lighting documentation, turf specification, installation drawings, packaging method, replacement process, lead time, and local compliance before placing an order.
Start With the Site, Not the Product Photo
A panoramic court can look similar across several quotations, but the underlying specifications may differ. The buyer should provide the supplier with basic project information:
- Project country and city
- Indoor, outdoor, rooftop, or coastal location
- Number and arrangement of courts
- Available site dimensions
- Local wind, snow, corrosion, and seismic requirements
- Required lighting performance
- Applicable building and electrical rules
- Intended construction schedule
- Container access and unloading limitations
A qualified local engineer should establish the project’s design loads and foundation requirements. A supplier drawing can support coordination, but it should not replace legally required local engineering approval.
Compare Complete Bills of Materials
I recommend a line-by-line comparison rather than comparing only the total price.
| Procurement area | Questions I would ask |
|---|---|
| Steel structure | What grades, sections, coatings, and connection details are specified? |
| Glass | What thickness, tempering standard, hole tolerances, and edge treatment apply? |
| Turf | What pile height, Dtex, density, backing, color, and infill requirement apply? |
| Lighting | What power, optics, mounting arrangement, and test documents are supplied? |
| Fasteners | Are all quantities listed, labeled, and packed by installation stage? |
| Drawings | Are foundation, pre-embedding, assembly, and component-numbering drawings included? |
| Spares | Which glass panels and wear items should the buyer hold locally? |
| Packaging | How are glass, steel, lights, turf, and accessories protected and identified? |
| Warranty | What defects are covered, excluded, and documented? |
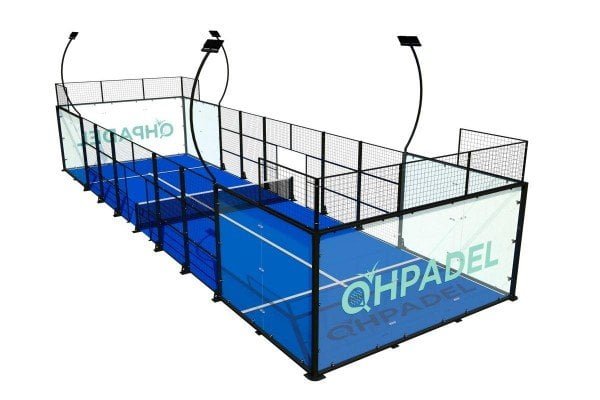
At QHPADEL, we manufacture complete court packages and provide installation drawings, foundation drawings, packing lists, and maintenance manuals. Our standard capability includes panoramic, ultra-panoramic, classic, single, roofed, and application-specific designs. I present these as manufacturing capabilities, not as evidence that every design suits every site.
Verify Certificates Rather Than Accepting a Logo
QHPADEL can provide documents associated with ISO 9001 and relevant CE, RoHS, AS/NZS, AD 2000, and PED requirements across specified product components. However, buyers should verify:
- The certificate holder
- Issuing or testing organization
- Standard and edition
- Product model or scope
- Issue and expiry dates
- Report number
- Any exclusions or installation conditions
- Acceptance by the local authority
A certificate for one component does not automatically certify the entire completed facility. Local engineers, certifiers, or authorities may require additional calculations and approvals.
Production capacity and lead time also require written confirmation for the actual order. QHPADEL operates 10 production lines and has stated capacity of more than 1.5 million square metres of artificial turf and 150 court systems per month. Standard production may range from approximately 20 days for two courts to no more than 30 days for larger standard orders, while custom projects may require up to 35 days. Buyers should confirm the schedule, specification, deposit date, inspection plan, and shipping availability in the contract.
Frequently Asked Questions
Is padel currently more popular than tennis?
No, tennis remains larger globally by total participation and installed infrastructure. Padel is expanding quickly and may have a higher recent percentage growth rate in selected markets. Popularity still varies by country, city, age group, and measurement method.
Why is padel growing so quickly?
Padel has a social doubles format, a relatively accessible learning curve, and a compact court footprint compared with some traditional sports facilities.7 Media exposure, professional competitions, booking technology, and private club investment also support growth. These factors do not guarantee sufficient demand in every location.
How many players does a padel club need?
The answer depends on the number of courts, operating hours, booking frequency, price, seasonality, and revenue model. Investors should calculate required unique and repeat players from conservative occupancy assumptions. They should not estimate demand solely by multiplying the local population by a global participation percentage.
Can padel courts be more profitable than tennis courts?
Padel courts can generate different revenue per unit of land because four players share a smaller playing area. However, profitability depends on utilization, construction cost, rent, staffing, energy, maintenance, finance, and local pricing. A qualified adviser should review project-specific projections.
Should I order courts before securing planning approval?
I generally advise buyers to confirm site control, planning requirements, design loads, foundation feasibility, and utility needs before final production. Early supplier coordination can support the approval process, but premature manufacturing may create costly changes if local authorities require a different layout or structural specification.
Conclusion
Padel growth appears faster than tennis on selected percentage-based participation and court-development measures, but tennis remains much larger in absolute scale. I believe investors should use global momentum to start an investigation, not finish one. Local demand, competing supply, achievable prices, site costs, utilization, and complete project risk will determine viability.
If you are evaluating a new club, QHPADEL can help you compare court configurations, bills of materials, technical documents, lead times, and shipping requirements. Contact Alice Chen at alice@grass-supplier.com or +86 185 7566 0746 to request a project-specific quotation and procurement review.
-
"World Padel Report 2024, the first official …", https://www.padelfip.com/2024/05/world-padel-report-2024-the-first-official-fip-report-on-the-padel-movement/. The International Padel Federation’s World Padel Report documents recent expansion in padel courts and participating countries; its figures should be read using the report’s stated market coverage and court-count methodology. Evidence role: statistic; source type: institution. Supports: Comparable reported growth in padel courts and geographic reach, including the report’s dates, market coverage, and definitions.. Scope note: This source can document padel expansion, but a direct comparison with tennis requires a matched tennis dataset using the same period and geographic scope. ↩
-
"ITF Global Tennis Report: Participation surges to 106 million …", https://www.itftennis.com/en/news-and-media/articles/itf-global-tennis-report-participation-hits-106-million-in-five-years/. The ITF Global Tennis Report reports global tennis participation and infrastructure at a scale substantially above the figures reported for padel by the International Padel Federation, subject to differences in reporting methods and reference years. Evidence role: statistic; source type: institution. Supports: The reported global scale of tennis participation and infrastructure and the corresponding reported scale of padel.. Scope note: The organizations’ player and facility definitions are not necessarily harmonized, so the comparison establishes broad scale rather than an exact like-for-like ratio. ↩
-
"Online the FIP World Padel Report 2025, a comprehensive analysis of …", https://www.padelfip.com/2025/12/online-the-fip-world-padel-report-2025-a-comprehensive-analysis-of-a-sport-in-constant-growth/. The International Padel Federation’s World Padel Report 2024 reports approximately 30 million amateur players and more than 60,000 padel courts worldwide, as defined and dated in the report. Evidence role: statistic; source type: institution. Supports: The World Padel Report’s reported worldwide estimates for amateur players and courts, including the report’s definitions and reporting date.. Scope note: These are federation report estimates rather than a universal census, and later editions or revisions may change the totals. ↩
-
"ITF Global Tennis Report: Participation surges to 106 million in just 5 …", https://www.itftennis.com/en/news-and-media/articles/itf-global-tennis-report-participation-hits-106-million-in-five-years/. The International Tennis Federation’s Global Tennis Report 2024 estimates global tennis participation at approximately 106 million players, according to the report’s specified survey sources and player definition. Evidence role: statistic; source type: institution. Supports: The ITF’s global estimate of tennis participation and the survey definition underlying that estimate.. Scope note: Participation estimates aggregate national data with varying collection methods and should not be assumed to measure the same activity threshold used in padel reports. ↩
-
"Back to Basics: Supply and Demand: When buyers and sellers get …", https://www.elibrary.imf.org/view/journals/022/0047/002/article-A018-en.xml. Standard supply-and-demand analysis defines excess supply as capacity offered beyond demand at prevailing prices; where facility capacity expands faster than paying demand, utilization and price assumptions may be pressured. Evidence role: mechanism; source type: education. Supports: The economic mechanism by which supply that grows faster than demand creates excess supply and pressure on prices or utilization.. Scope note: The mechanism is general economic theory and does not by itself show that oversupply exists in any named local padel market. ↩
-
"Contradiction between Supply and Demand of Public Sports …", https://pmc.ncbi.nlm.nih.gov/articles/PMC9467751/. Facility-planning research treats new capacity as a supply-side measure and evaluates demand separately through use, participation, access, and utilization indicators; construction activity alone does not demonstrate sustained patronage. Evidence role: general_support; source type: research. Supports: Research or planning guidance distinguishing facility provision or capacity from demonstrated utilization and demand.. Scope note: General facility-planning evidence is contextual and does not determine demand for a particular padel venue. ↩
-
"Motivational Determinants of Recreational Padel Participation", https://pmc.ncbi.nlm.nih.gov/articles/PMC12656352/. Studies of padel participation identify social interaction and perceived accessibility among commonly reported motives, while official rules specify a doubles format and compact court dimensions relative to many field sports. Evidence role: mechanism; source type: paper. Supports: Research on reported motivations for padel participation, together with official court dimensions and format.. Scope note: Reported participant motives and court dimensions provide plausible context for growth but do not establish that these factors caused growth in every market. ↩